Case Study: Market Guard (Market Crash/Recovery Detection)
Here we test our Market Crash/Recovery Indicator against the largest US economy market crashes and bear markets in recent history. In order to retroactively consider past Forewarnings a success, we must see a Red flag thrown within the first 20% of the total amount lost that market crash or bear market endured.
(Note: All flags are determined by the live data that is currently available during that bar/candle. It does not repaint or adjust past results based on following market performance.)
(Note: All flags are determined by the live data that is currently available during that bar/candle. It does not repaint or adjust past results based on following market performance.)
×
![]()
| Type | Crash | Date | Our Indicator | Causes | Chart |
|---|---|---|---|---|---|
 |
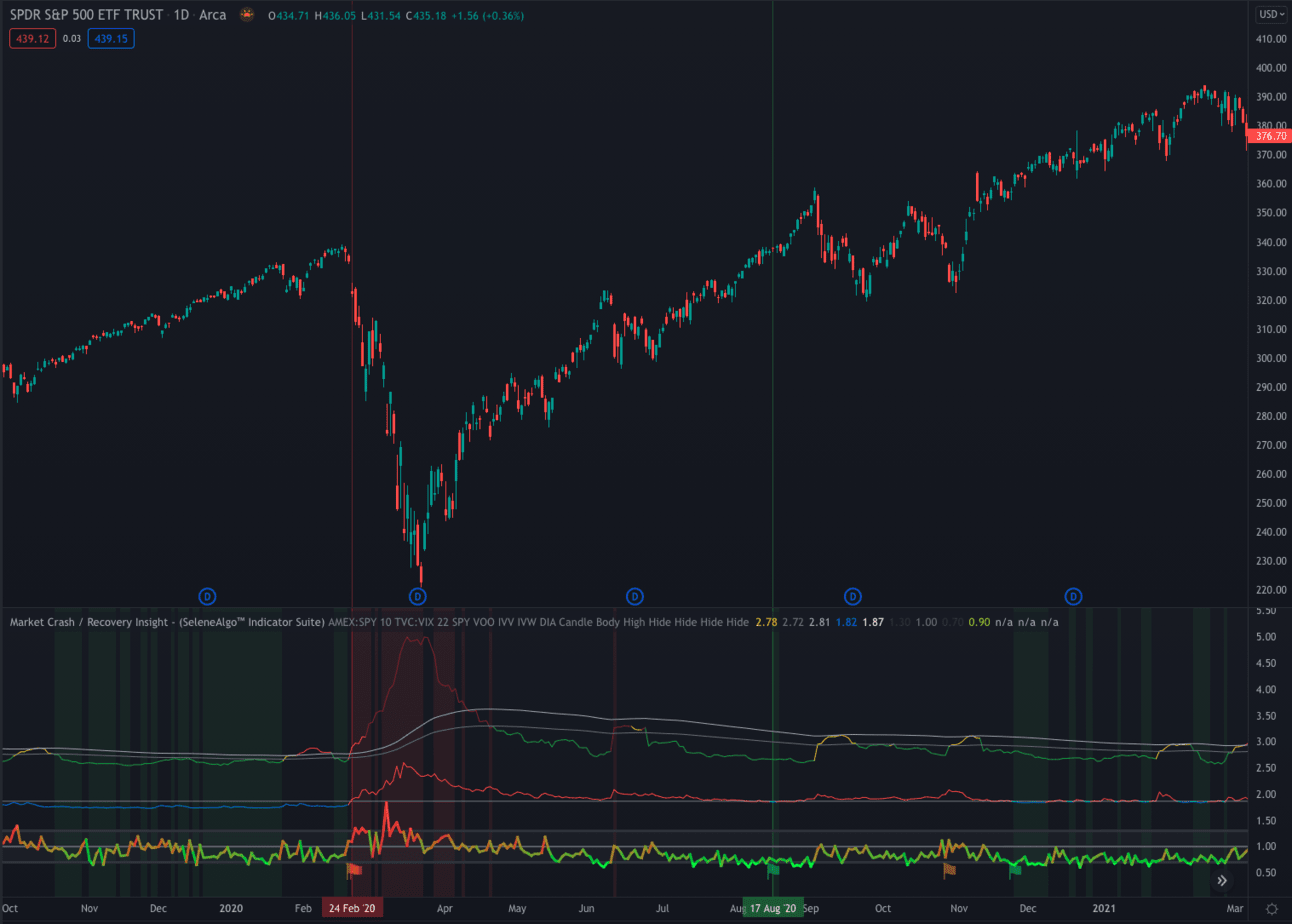
2020 COVID Market Crash | 24 Feb 2020 |
Feb 24: Caution flag
Feb 25: Red flag
Forewarning Result: Success
Back to back Caution then Red flags were thrown when the market reached a 6% loss out of the eventual max loss of 34% (Mar 23) saving users from an extremely sharp downturn. |
The S&P 500 index dropped 34%, 1145 points, at its peak of 3386 on February 19 to 2237 on March 23. This crash was part of a worldwide recession caused by the COVID-19 pandemic. |
|
 |
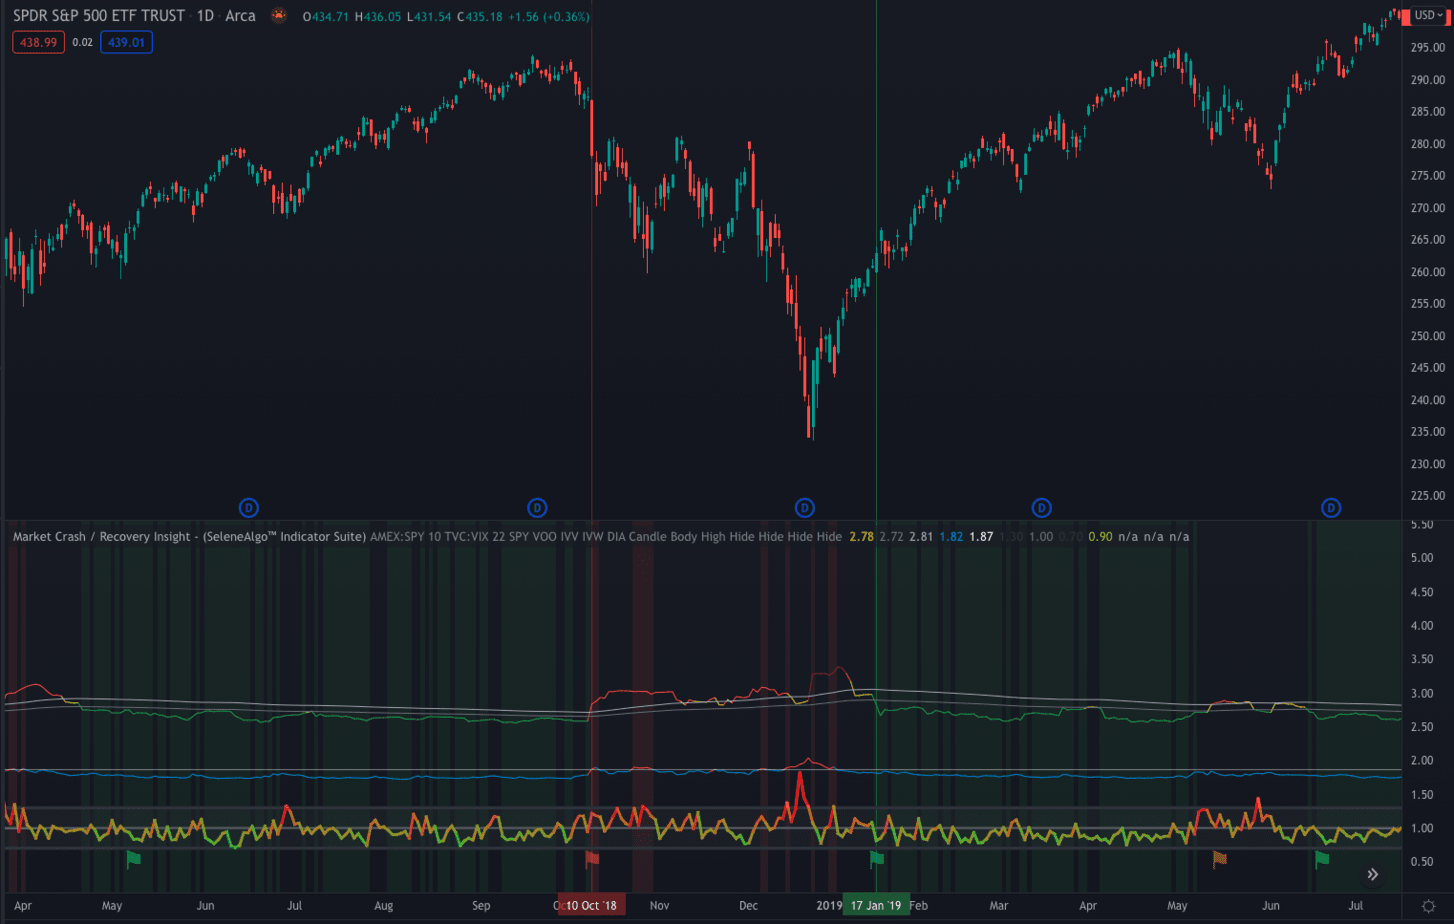
Bear Market 2018 | 20 Sep 2018 |
Oct 10: Red flag
Forewarning Result: Success
A Red flag was thrown 3 weeks after the peek of S&P 500 and 11 weeks prior to the bear market rally end. |
The S&P 500 index peaked at 2930 on its September 20 close and dropped 19.73% to 2351 by Christmas Eve. Brexit’s impact on the United Kingdom and Europe worried investors, as did a slowdown in the Chinese economy. Note: Wikipedia mistakenly combined 2017 crypto crash with 2018 market crash. |
|
|
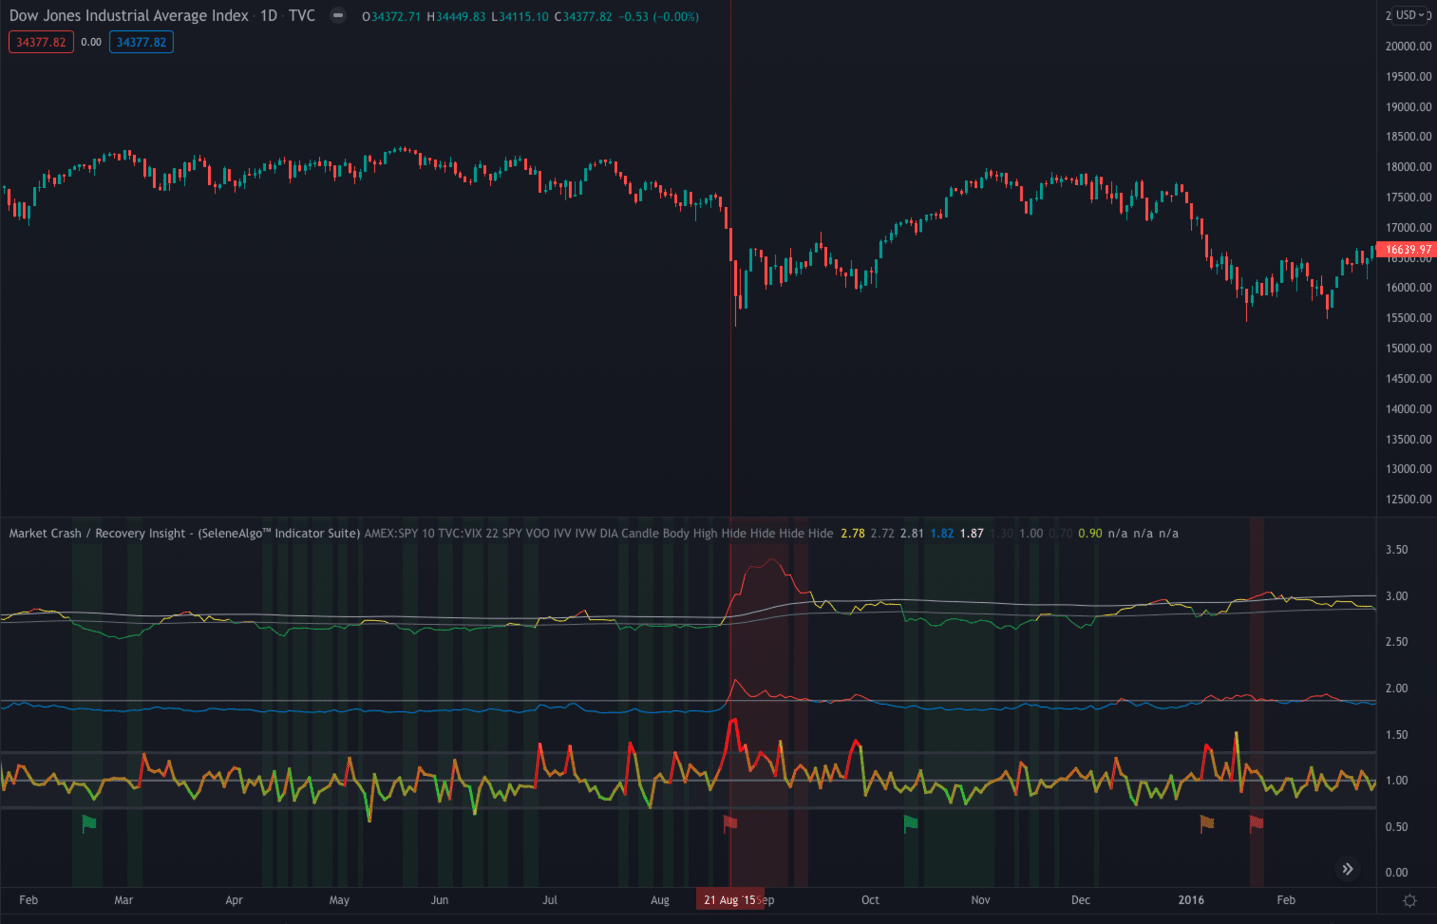
2015–16 Stock Market Selloff | 18 Aug 2015 |
Aug 21: Red flag
Forewarning Result: Failure
A Red flag was thrown 2 days after the short lived bear market rally started. While the flag was still thrown 2 market days prior to its lowest low (Aug 25), we still consider the Red flag timing to be outside acceptable parameters. |
The Dow Jones fell 588 points during a two-day period, 1,300 points from August 18–21. On Monday, August 24, world stock markets were down substantially, wiping out all gains made in 2015, with interlinked drops in commodities such as oil, which hit a six-year price low, copper, and most of Asian currencies, but the Japanese yen, losing value against the United States dollar. With this plunge, an estimated ten trillion dollars had been wiped off the books on global markets since June 3. |
|
|
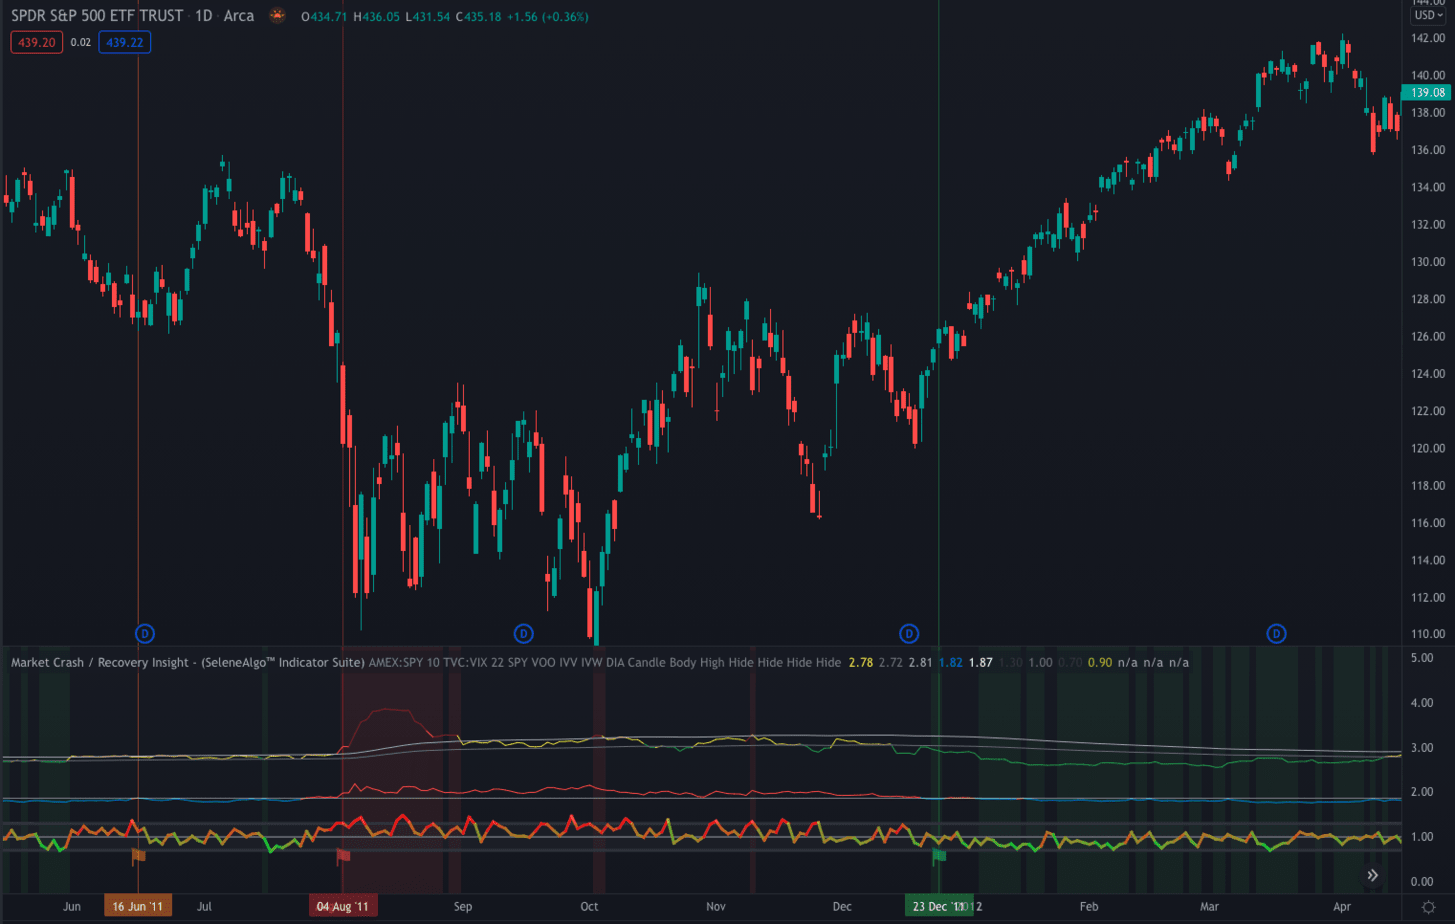
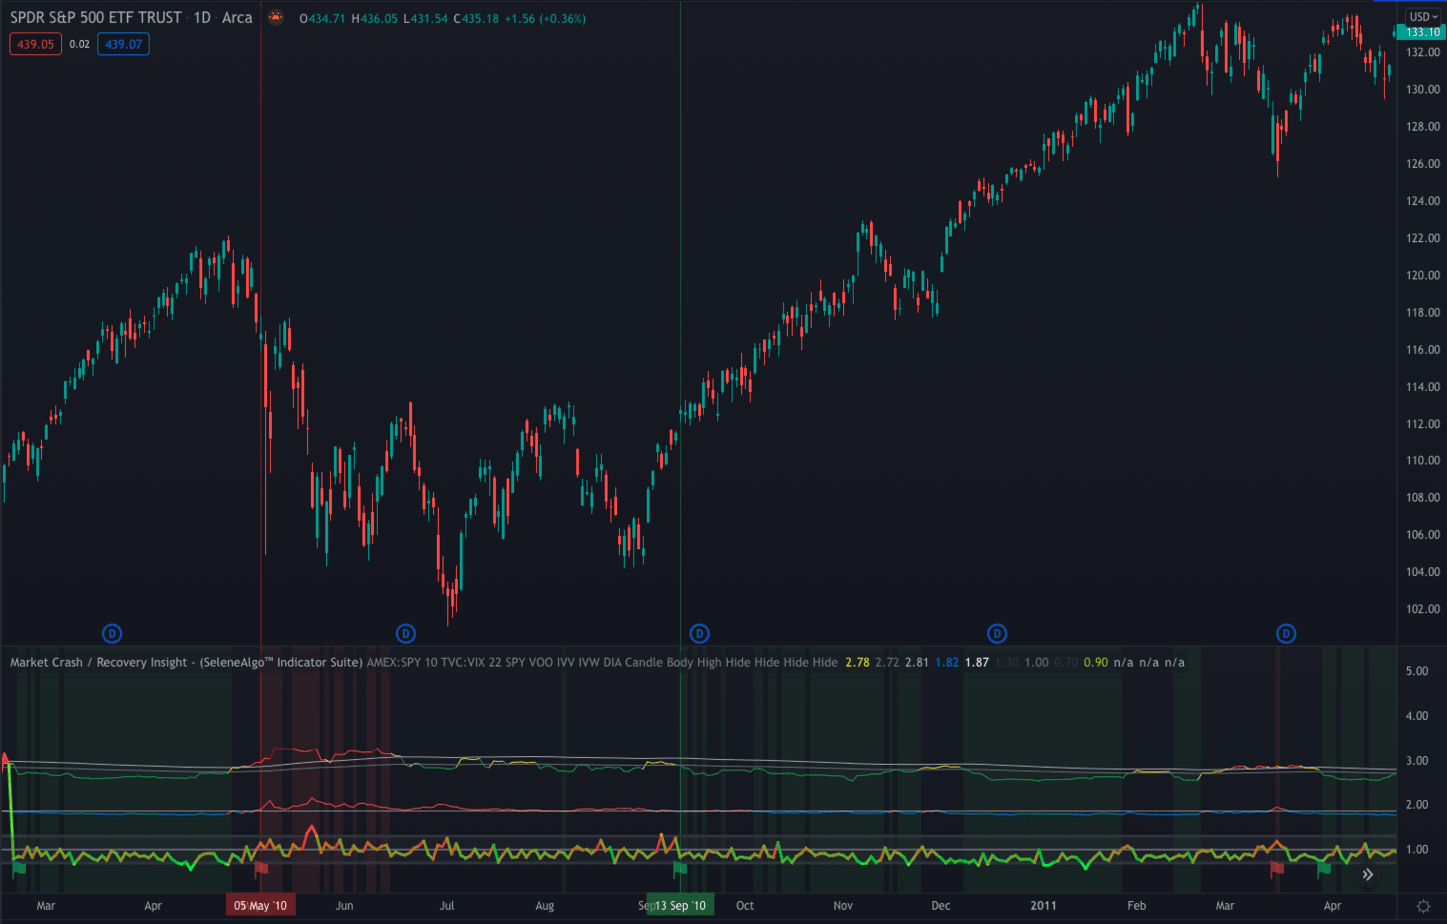
August 2011 Stock Markets Fall | 1 Aug 2011 |
Jun 16: Caution flag
Aug 04: Red flag
Forewarning Result: Late
Even though a warning flag was thrown 6 weeks prior hinting market uncertainty, a Red flag was thrown 3 days after the bear market started. While the flag was still thrown 3 days prior to the worst day since the 2008 crisis (Aug 8), we still consider the Red flag timing to be outside acceptable parameters. |
S&P 500 entered a short-lived bear market between 2 May 2011 (intraday high: 1,370.58) and 04 October 2011 (intraday low: 1,074.77), a decline of 21.58%. The stock market rebounded thereafter and ended the year flat. |
|
|
2010 Flash Crash | 6 May 2010 |
May 05: Red flag
Forewarning Result: Success
Red flag was thrown the day before the market crash. |
The Dow Jones Industrial Average suffered its worst intra-day point loss, dropping nearly 1,000 points before partially recovering. |
|
|
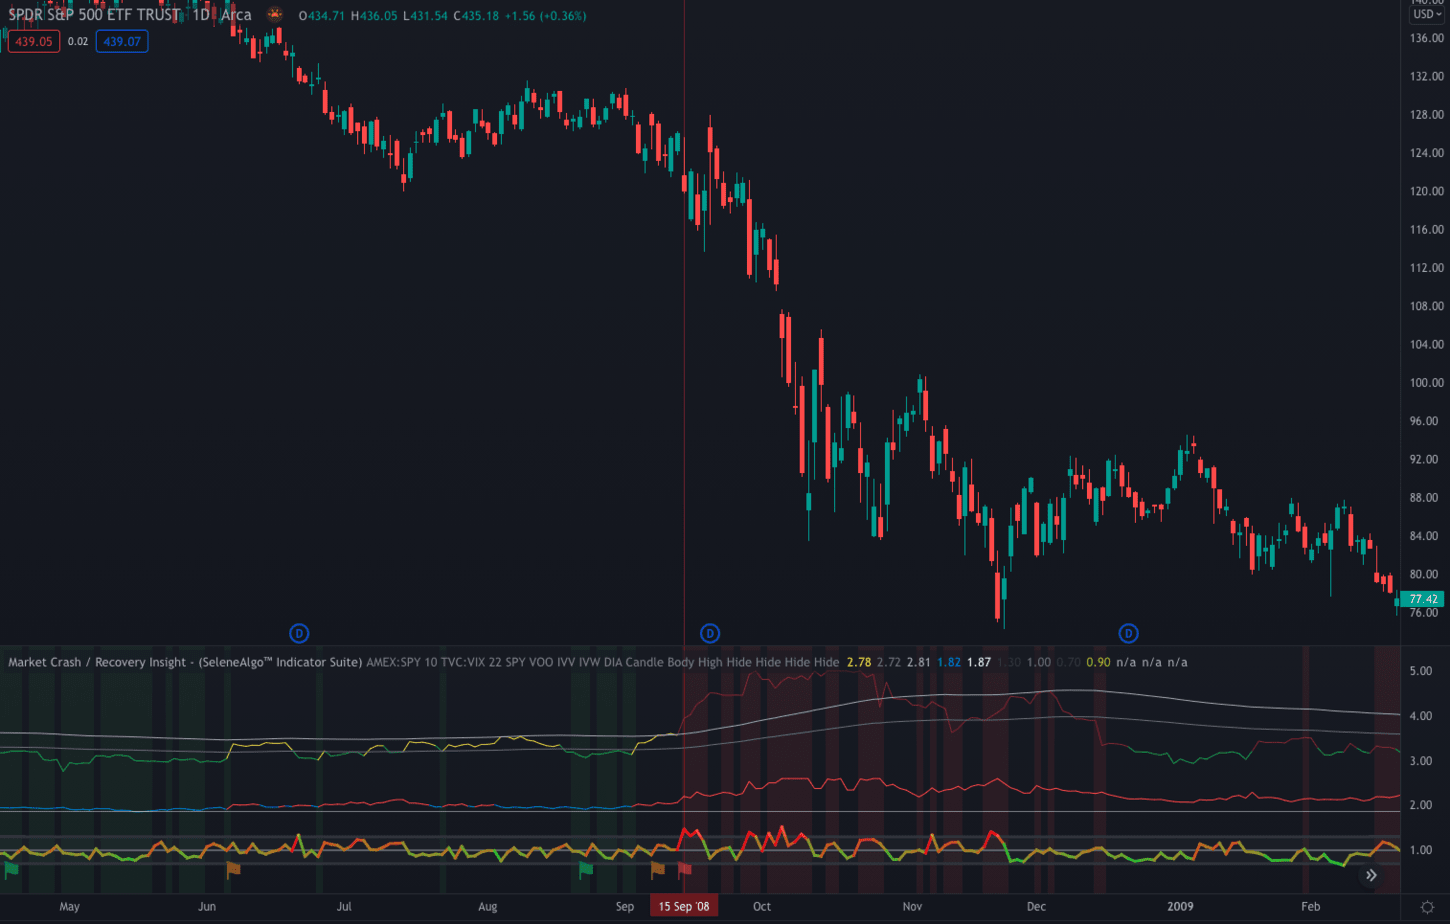
Housing Crisis of 2008 | 16 Sep 2008 |
Sept 15: Red flag
Forewarning Result: Success
Red flag was thrown the day before the bank crisis and 3 days prior to rapid following bear market. |
On September 16, 2008, failures of large financial institutions in the United States, due primarily to exposure of securities of packaged subprime loans and credit default swaps issued to insure these loans and their issuers, rapidly devolved into a global crisis resulting in a number of bank failures in Europe and sharp reductions in the value of equities (stock) and commodities worldwide. The Dow would plummet 3,600 points from its Sept. 19, 2008 intraday high of 11,483 to the Oct. 10, 2008 intraday low of 7,882. |
|
|
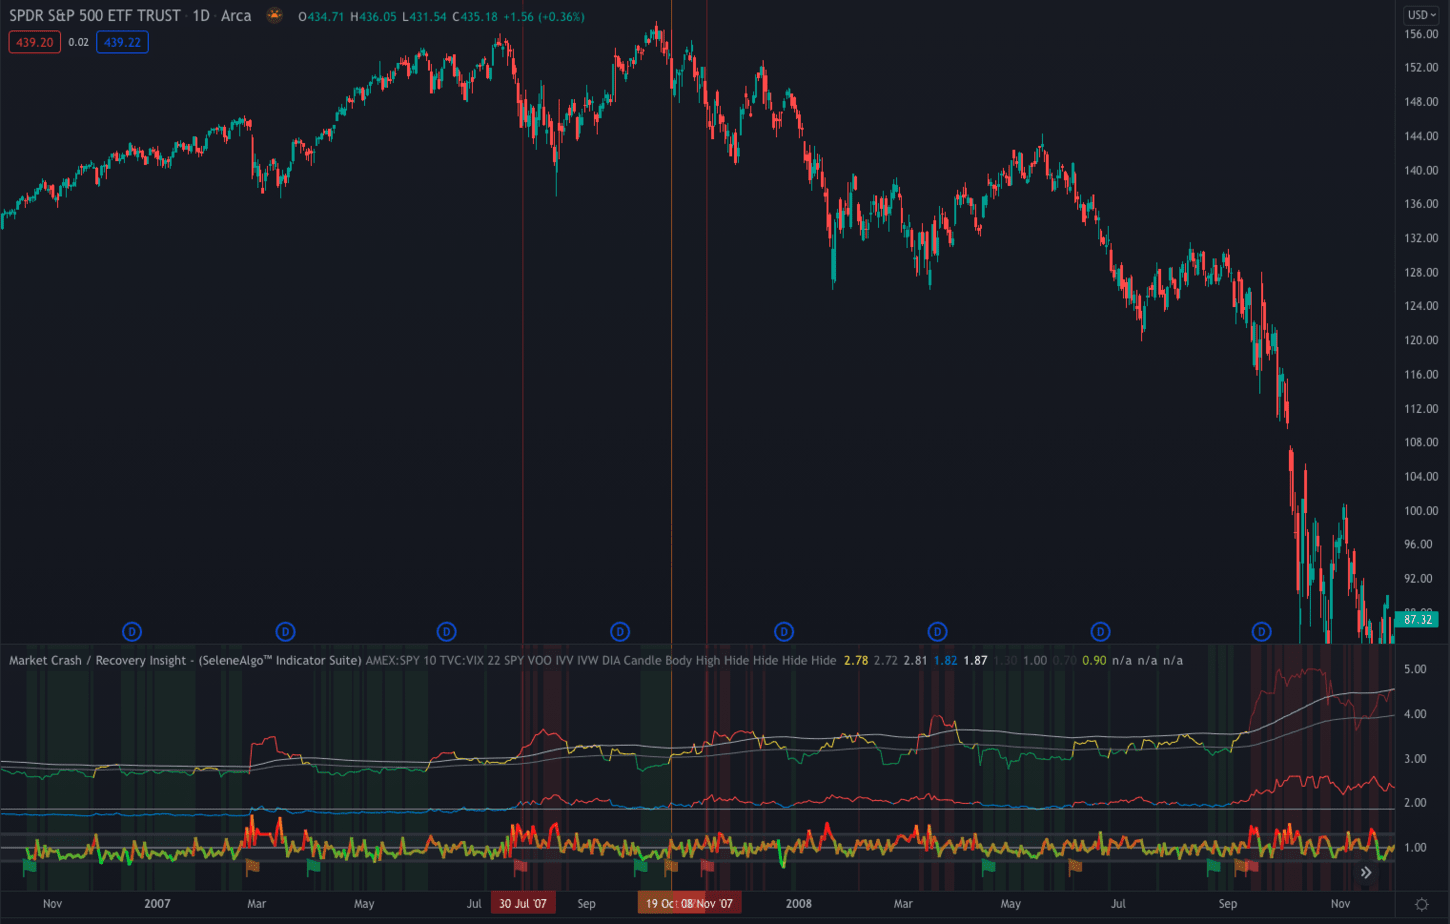
Bear Market 2007–2009 | Oct 2007 – Mar 2009 |
Early signs of market uncertainty was detected 3 months prior
Oct 19: Caution flag
Nov 08: Red flag
Forewarning Result: Success
Red flag was thrown 3 weeks into a 17 month bear market. |
From their peaks in October 2007 until their closing lows in early March 2009, the Dow Jones Industrial Average, Nasdaq Composite and S&P 500 all suffered declines of over 50%, marking the worst stock market crash since the Great Depression era. |
|
Sources:
https://en.wikipedia.org/w/index.php?title=List_of_stock_market_crashes_and_bear_markets
https://www.investopedia.com/articles/economics/09/subprime-market-2008.asp
https://money.cnn.com/2011/08/08/markets/markets_newyork/index.htm
https://www.cnn.com/2018/12/31/investing/dow-stock-market-today/index.html